This post summarizes the design and results from a set of tests recently conducted at Super Radiator Coils.
Plate fin-tube heat exchangers are widely used in many residential, commercial, and industrial systems, such as HVAC, food freezing/drying, data center cooling, heat recovery, dehumidification, etc.
One critical consideration when designing a plate fin heat exchanger is air friction. The amount of air friction will determine the air flow rate, which is generated by a fan, and varies depending on surface conditions. Given air friction’s importance when designing coils, this phenomenon has been studied under dry and clean surface conditions by many researchers in past decades.
When fouling of the heat exchanger surface occurred or when condensate formed, the air friction increased dramatically, lowering the air flow rate, and reducing the heat exchanger’s capacity. Air friction is always the function of face velocity, but the relationship between the two varies with different tube patterns, fin configurations, etc.
Now, on to the test. Under wet-surface conditions, ARI standard 410-2001 (2001) required that the test be conducted with the entire air-side surface actively condensing moisture. To make sure the air-side surface is fully wetted, the following conditions should be ensured.
For these tests, heat exchangers were installed in a closed-loop wind tunnel with a blower circulating air within it (see Figure 1). The air flow’s direction was perpendicular to the front face of the heat exchanger. The condensate that formed on the heat exchanger surface either fell of due to gravity or was blown off by air flow. A water heater and a glycol cooler were used to control the air temperature inside the tunnel.
The hot water was from a hot water tank. The cooling medium in the cooler was a propylene glycol solution from a chiller. A humidifier was used to adjust the air inlet humidity. The air flow rate was measured by a set of air nozzles. RTD temperature sensors were used to measure the air inlet/outlet temperatures as well as cold water inlet/outlet temperatures.
The air’s relative humidity was measured at the inlet and outlet. The pressure drop on the air side was measured by differential pressure transducers. The water flow rate was measured with a turbine flow meter. All sensors and meters were calibrated according to ASHRAE standards.
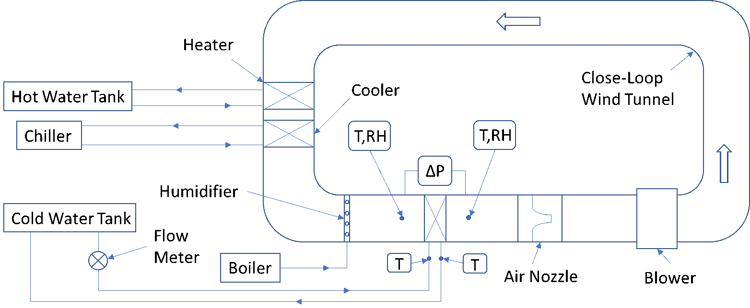
Figure 1: Schematic testing system and main components
All tests were conducted in the wind tunnel lab at Super Radiator Coils. The ANSI/ASHRAE Standard 33-2016 was followed throughout the test. All sensors and meters were calibrated according to ASHRAE standards every 12 months. The air friction data was recorded during dry-surface cooling tests and wet-surface cooling tests. During the dry-surface cooling tests, the water inlet temperature was controlled to remain higher than the air dew-point temperature at the inlet condition to avoid any condensate inside the fin bundle.
The air face velocity, the inlet air dry-bulb temperature, the air inlet humidity, the water inlet temperature and flow rate were maintained and recorded under steady-state conditions during the test. The condensate that formed inside the heat exchanger was captured by a pan positioned underneath the test heat exchanger and the water’s weight was measured every 30 min.
Heat exchanger #1 was tested under dry and wet-surface conditions. This heat exchanger was a 10-row coil with corrugated fin, the density of which was 10 FPI (394 FPM). The fin thickness was 0.0095 inch (0.24 mm). The circuitry was a pure thermal counter flow configuration. The air friction vs. face velocity under dry-surface condition is shown in Figure 2. The air friction was directly measured across the heat exchanger.
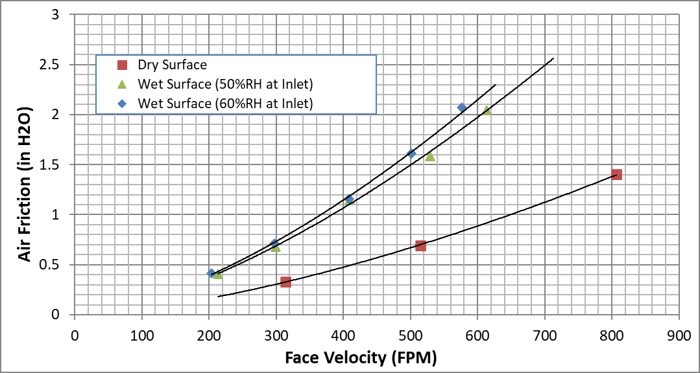
Figure 2: Air friction for heat exchanger #1 under dry and wet-surface conditions
Figure 2 shows the measured air friction for heat exchanger #1 under dry and wet-surface conditions. The dry-surface condition means there was no condensate on the heat exchanger surface. The air friction under dry-surface condition is the function of the face velocity, with higher face velocity leading to higher air friction.
As condensation occurs on the heat exchanger surface, the air friction becomes much higher than that under the dry-surface condition. The reason for the difference in air friction between dry surface and wet surface is the condensate. The condensate in the heat exchanger bundle blocks the passage of air, creating additional resistance for the air flow.
Figure 2 also shows two sets of tests under wet-surface conditions – 50% RH and 60% RH at air inlet. During these wet-surface tests, the inlet air temperature, inlet water temperature and flow rate were kept constant.
The air friction at 50% RH condition was about 200% higher than that under the dry surface condition at 210 FPM face velocity. That difference in air friction increased to 225% at 310 FPM and 230% at 510 FPM.
The air friction at 60% RH condition was higher than that of 50% RH condition at each face velocity. When the face velocity was lower than 300 FPM, the difference in air friction was relatively small. As face velocity increased, the difference in air friction at wet-surface condition increased as well.
At a face velocity of 500FPM, the air friction at 60% RH was about 6.7% higher. When the face velocity exceeded 500FPM, the condensate carry-over became significant.
Figure 3 shows the impact of condensate rate on air friction at the same face velocity for heat exchanger #1. In this figure, the face velocity is fixed at 300 FPM. The air inlet temperature, air inlet relative humidity, cooling water inlet temperature, and cooling water flow rate were varied to create different condensate rates.
The maximum condensate rate was 180 lb./hr. The minimum condensate rate was 0.1 lb./hr. The maximum air friction was about 0.668 in. H2O. The minimum air friction was 0.427 in. H2O. The higher the condensate rate, the higher the air friction. From Figure 2, the air friction at the same face velocity on dry surface condition is about 0.3 in. H2O. So, even when only a tiny amount of condensate was present, air friction increased by more than 40%. When the condensate rate was higher than 120 lb./hr., the air friction reached the maximum value and did not increase further.
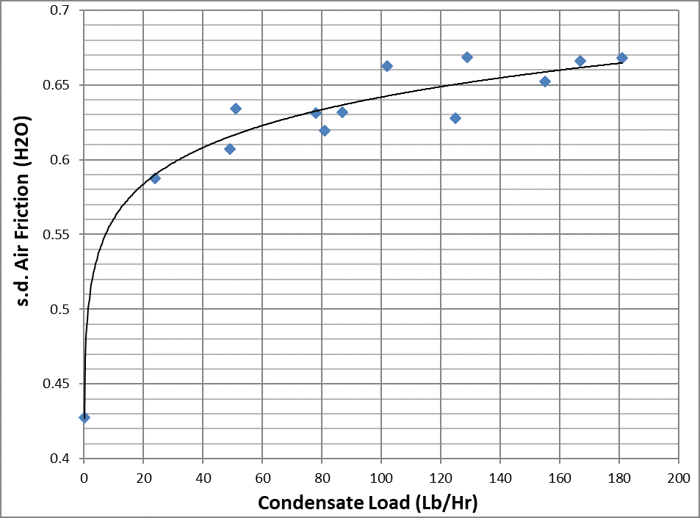
Figure 3 Condensate rate impact on air friction for heat exchanger #1
Don’t get left out in the cold when it comes to heat transfer information. To stay up to date on a variety of topics on the subject, subscribe to The Super Blog, our technical blog, Doctor's Orders, and follow us on LinkedIn, Twitter, and YouTube.If you're in the market for heat exchangers, let's work together to get you just the right tool for the job.